Coze offers three different displays of the data we gather during your product's inspection:
1.Summary
2.Report table
3.Product by product view
All of the displays update as the tester inspects the products, so you can Know what is happening in the factory in real time.
Following, are explanations about these three displays, and how you can get the most out of them.
1.Summary
2.Report table
3.Product by product view
All of the displays update as the tester inspects the products, so you can Know what is happening in the factory in real time.
Following, are explanations about these three displays, and how you can get the most out of them.
Our summary
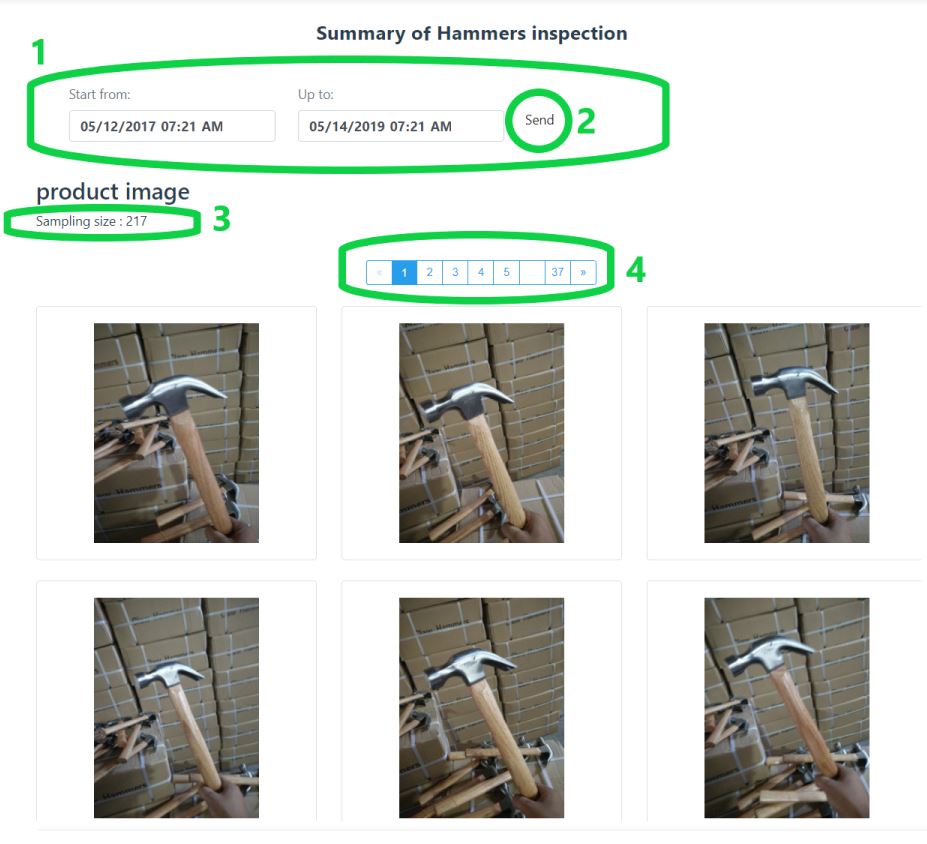
On the summary you can see all the data the tester collects during the inspection, including graphs with statistical analysis of the results, pictures galleries, and inspected quantity of products.
|
1.If you want to see the results from a specific inspection you can always change the date of the summary to watch results from a specific date.
2.After you change the date, you you need to click the "send" button and the summary will present you with the relevant information.
3.Here you can see the quantity of the inspected numbers for the parameter.
4.These are the photos gallery pages. you can click on different pages numbers to browse through the gallery.
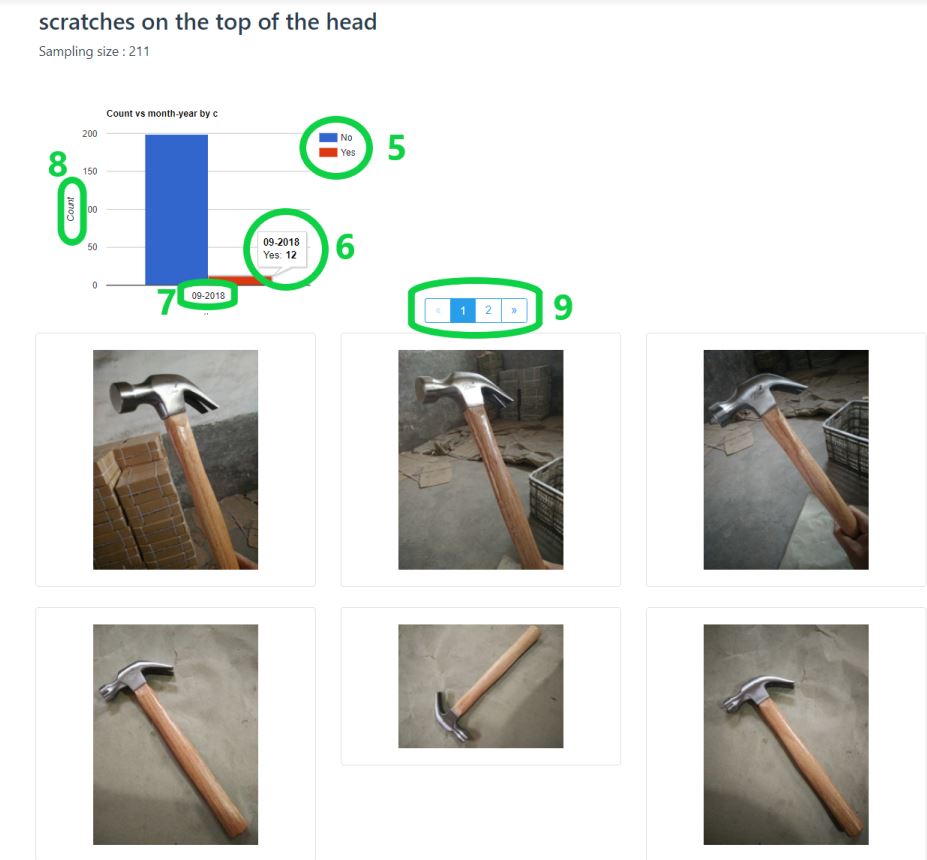
5.Here you can see the graph's index that tells you what each column represents. . The graph in the picture presents the quantity of products with scratches, while yes means there are scratches.
6.To see the exact number of the defected products, you can hover above the column with your mouse.
7.This is the date of the inspection. It might come in handy when you will have many inspections for the same product and you'd want to compare between them.
8.The count represents the quantity of products.
9.Below every graph that relates to visible defects you will see a gallery of defects' close up pictures.
|
|